Quickplot of a 2d cube on a map
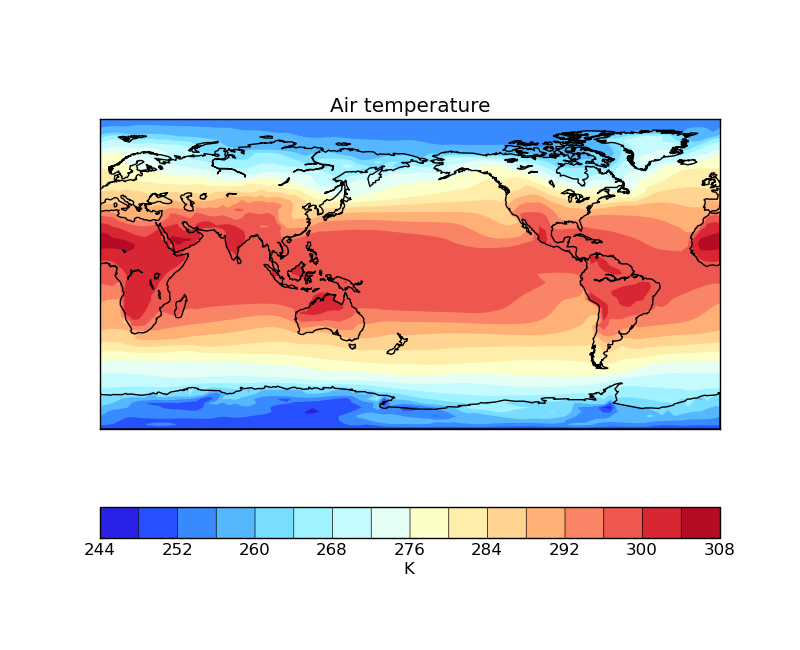
This example demonstrates a contour plot of global air temperature. The plot title and the labels for the axes are automatically derived from the metadata.
"""
Quickplot of a 2d cube on a map
===============================

This example demonstrates a contour plot of global air temperature.
The plot title and the labels for the axes are automatically derived from the metadata.

"""
import matplotlib.pyplot as plt

import iris
import iris.plot as iplt
import iris.quickplot as qplt


def main():
    fname = iris.sample_data_path('air_temp.pp')
    temperature = iris.load_strict(fname)

    qplt.contourf(temperature, 15)
    iplt.gcm().drawcoastlines()
    plt.show()


if __name__ == '__main__':
    main()